The most disruptive type of data
Product Manager for the Bus Open Data Service, Ben Murray, on collaboration, the distinction between what became known as simple and complex fares, and how Passenger is leading the way with visualising machine readable NeTEx data — the most disruptive type of data — in a way that the operators can understand, verify and fix if they need to.
22nd Mar 2024

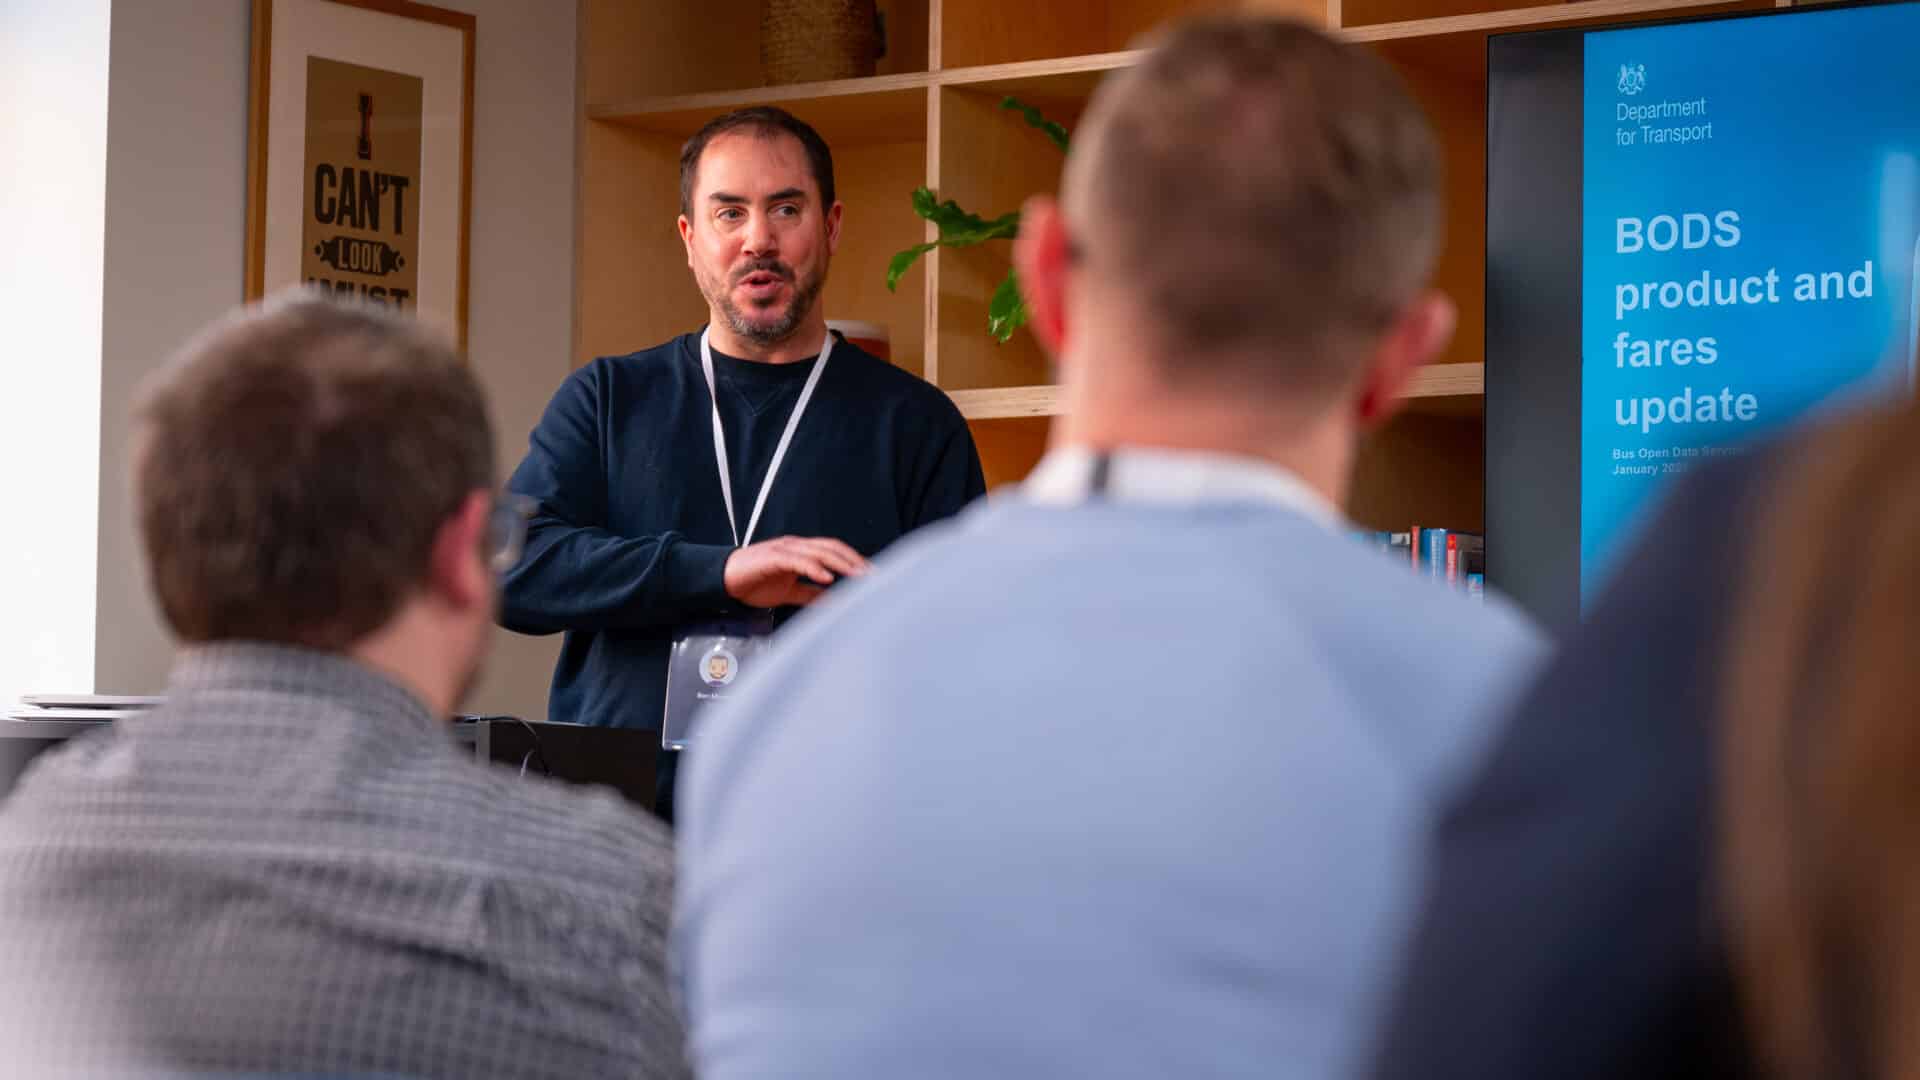
In late January 2024, we sat down with Ben Murray, KPMG’s Product Manager on the Department for Transport’s BODS programme, to discuss the latest phase of the programme: bus fare data.
We asked Ben about the importance of collaboration in the success of programmes like BODS and what he sees as the role technology suppliers can play in shaping the service. He talks about the distinction between what became known as simple and complex fares in the Bus Open Data Service, and with the work it has done recently to deliver its Discovering Fares capability, how Passenger is “ahead of the curve” with visualising machine readable NeTEx data in a way that the operators can understand, verify and fix if they need to.
We haven’t seen fares data used in the wild.
We feel like it can be the most disruptive type of data, the most helpful type of data for passengers to decide if this is the right way for them to travel. And there’s a lot of moving parts to pull together to make that work. And no one’s tried to do that yet. So, there’s going to be a painful journey of discovery and iterative approach to improving that experience for the passengers that you’re going through for the first time.
So, I think Passenger will be forging the way for other app developers, other technology firms, that are surfacing data for passengers that can learn a lot from what you’re doing and the experience that you have to make sure that they can follow in your wake, to make sure that they provide a good experience for the passengers based on the experience that you’ve taken from this process.
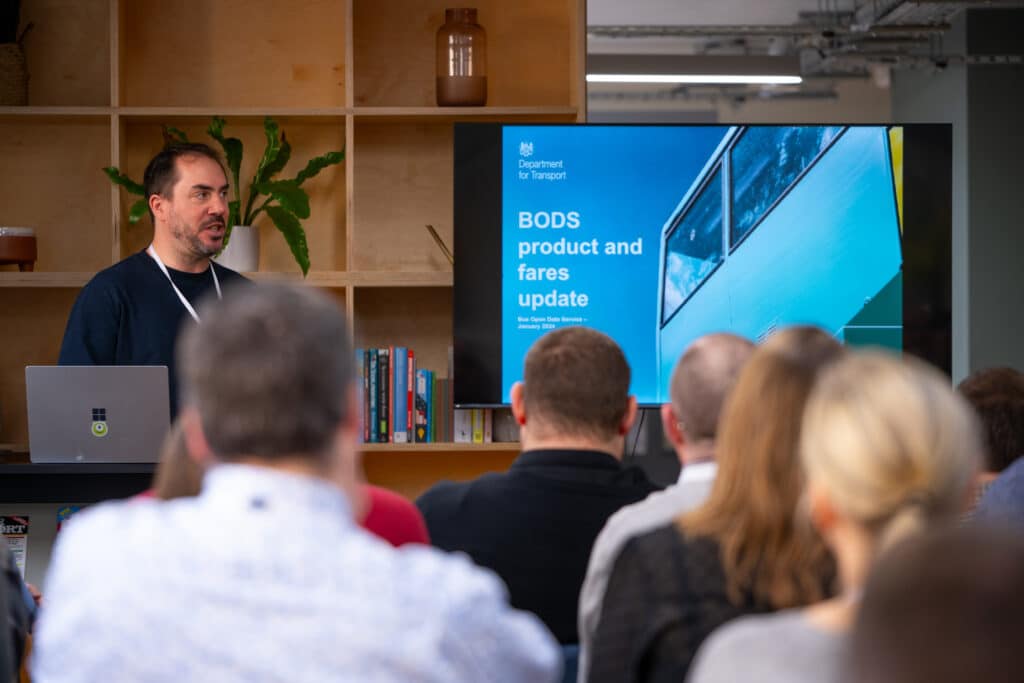
I am Ben. I’m part of the KPMG team delivering BODS for the DfT.
So, collaboration is really crucial for the BODS program. It’s collaboration across all sorts of different stakeholders from understanding what the passengers need. So, we’re talking to passenger groups, to the operators that are delivering the services for those passengers, and then collaborating with all the technology suppliers that enable those operators to deliver those services.
So, those that are helping operators to schedule their services or to generate their timetables and to plan the way that their fleet is going to be operating through the day, and then communicating the live locations of those buses, pulling all of that data together. It’s pulling data from different teams and different technologies and, and supplying a single view for the passenger, but it’s a collaboration for all those parties involved to get that data in front of the passenger.
The idea of simple fares and complex fares was, I think, a way to identify the scope of how to separate the work that needs doing about getting information about fares in front of passengers. But there is no real distinction between what a simple, well complex fare is in terms of how hard it is to do it.
It’s more about the types of things that we want to want to get across, and so we scoped out the work, in terms of the different types of tickets that can be supplied. And then this, the complex element is around the different parameters that can be used to define those so durations and whether it’s capped and in different elements to describe those products.
So we are now at a stage where that scope question is historical and so we are now looking at providing a complete set of documentation for all the different products, types and product structures and the different ways of configuring these.
So now all the documentation and all the work that we’ll be doing will be ensuring that we provide a complete structure for all of the different types of products that operators might want to put in front of passengers, with the data that passengers need.
They need all of the data, they need it to be complete, and they need it to be up to date. It needs to be timely, and it needs to be accurate. And it’s really straightforward to make sure that all of the data is present and it’s up to date, but it’s not very easy for the different teams that are involved in presenting that data to passengers to make sure that it’s accurate.
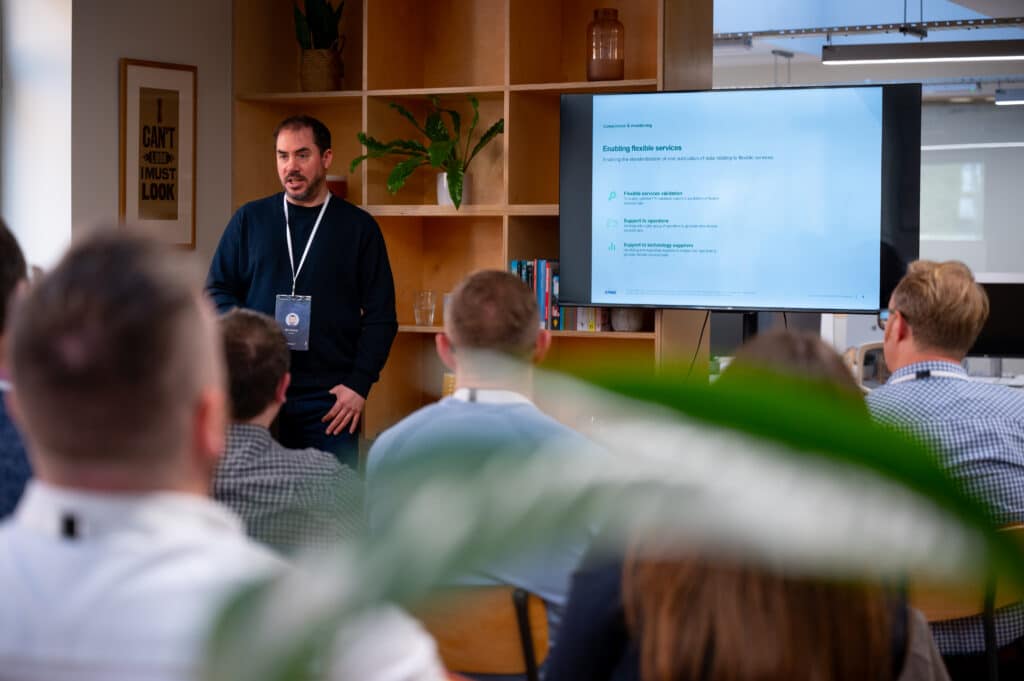
You need to be able to inspect that data, which is something that we haven’t really been able to see done.
There’s lots of different ways to generate this data and there’s lots of different technologies that can be used by the operators and their teams to create the machine readable data that’s needed to communicate the different price structures and product structures that there are. But there is currently no single way on BODS to summarise all of that data in a single visualised way so that you can inspect it for accuracy, make sure that the prices are right, make sure the product structures are right, and so having Passenger’s offering to visualise that data, enable the operator to check it for accuracy before it’s presented to the passengers is really helpful.
It’s something we’d like to see done on BODS so that every operator can inspect the data for accuracy, but I think Passenger are ahead of the curve with, with describing the machine readable data in a way that the operators can understand and can verify and fix if they need to.
I think that when the data is produced and the operator has generated and shared that data, it’s important for the operator to be able to confirm that that data is accurate, it’s structured properly, and the operator’s data will be out in the world.
It’ll be published so that it can be used by a variety of different consumers and a variety of different apps and platforms that will be visualising this for passengers. And it’ll be very important for the operators to make sure that the data is correct, but also it’d be helpful for those different platforms and those different technologies to compare the different visualisations that exist and make sure that they all reconcile with each other.
They’re all agreeing, they’re all saying the same thing, that this journey is going to cost this amount of money and there isn’t any difference between what the price is presented to a passenger depending on whether the use application A or application B. So, making sure that there’s a joined up communication. They’re all agreeing that this product for this journey is going to cost this amount of money.

Newsletter
We care about protecting your data. Here’s our Privacy Policy.
Related news

12th Feb 2024
Passenger launches online bus fare discovery based on NeTEx
For the first time, riders can find out how much their journey will cost before catching the bus. The new capability has been launched today with Brighton and Hove Buses, Metrobus in Surrey, Warrington’s Own Buses, Reading Buses, Thames Valley Buses and Nottingham City Transport.
16th Feb 2024
The importance of Passenger’s ticket coverage concept to delivering new fares capability
As a relatively unknown data standard in the UK, learning how to use NeTEx and where it fits into existing product capability has been a focus for our Product and Engineering teams over the last year. Ticket coverage, or zones, is a key product concept integral to answering the question; how much will it cost?
20th Mar 2024
The fares journey: from workshop to working product
The delivery of a new feature can be easy to understand in retrospect, especially once it can be touched, felt and easily understood. But bringing everyone on the journey is key to reaching the promised land. From conversations and sketches to app update, read how our new fares capability evolved.

Start your journey with Passenger
If you want to learn more, request a demo or talk to someone who can help you take the next step forwards, just drop us a line.