Studying Urban Traffic Control systems with Transport for London
13th Apr 2016

One thing we do a lot of at Passenger is research and development. By looking at the bigger picture we can help our customers to understand how lots of different systems and data sources can work together to make their passengers lives easier. This strengthens the retail relationship and helps to build brand loyalty in the competitive environment that lies beyond London’s city limits.
Urban Traffic Control systems (UTC) have been helping vehicles flow in cities for decades. For example, traffic lights in London are automatically adjusted with the help of SCOOT system (Split Cycle Offset Optimisation Technique) and thousands of induction loop sensors on the roads. These sensors provide binary data every quarter of a second (1 if there is a vehicle on top, 0 otherwise), so each sensor ends up with 345,600 values every day. There are around 12,000 sensors in London, adding up to 4.1 billion data points every single day. And that’s just for London!
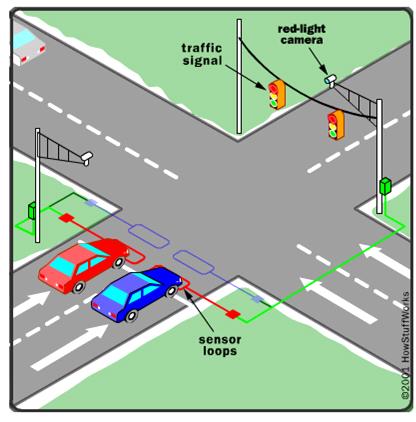 Inductive loop sensors help to monitor the traffic (pic source)
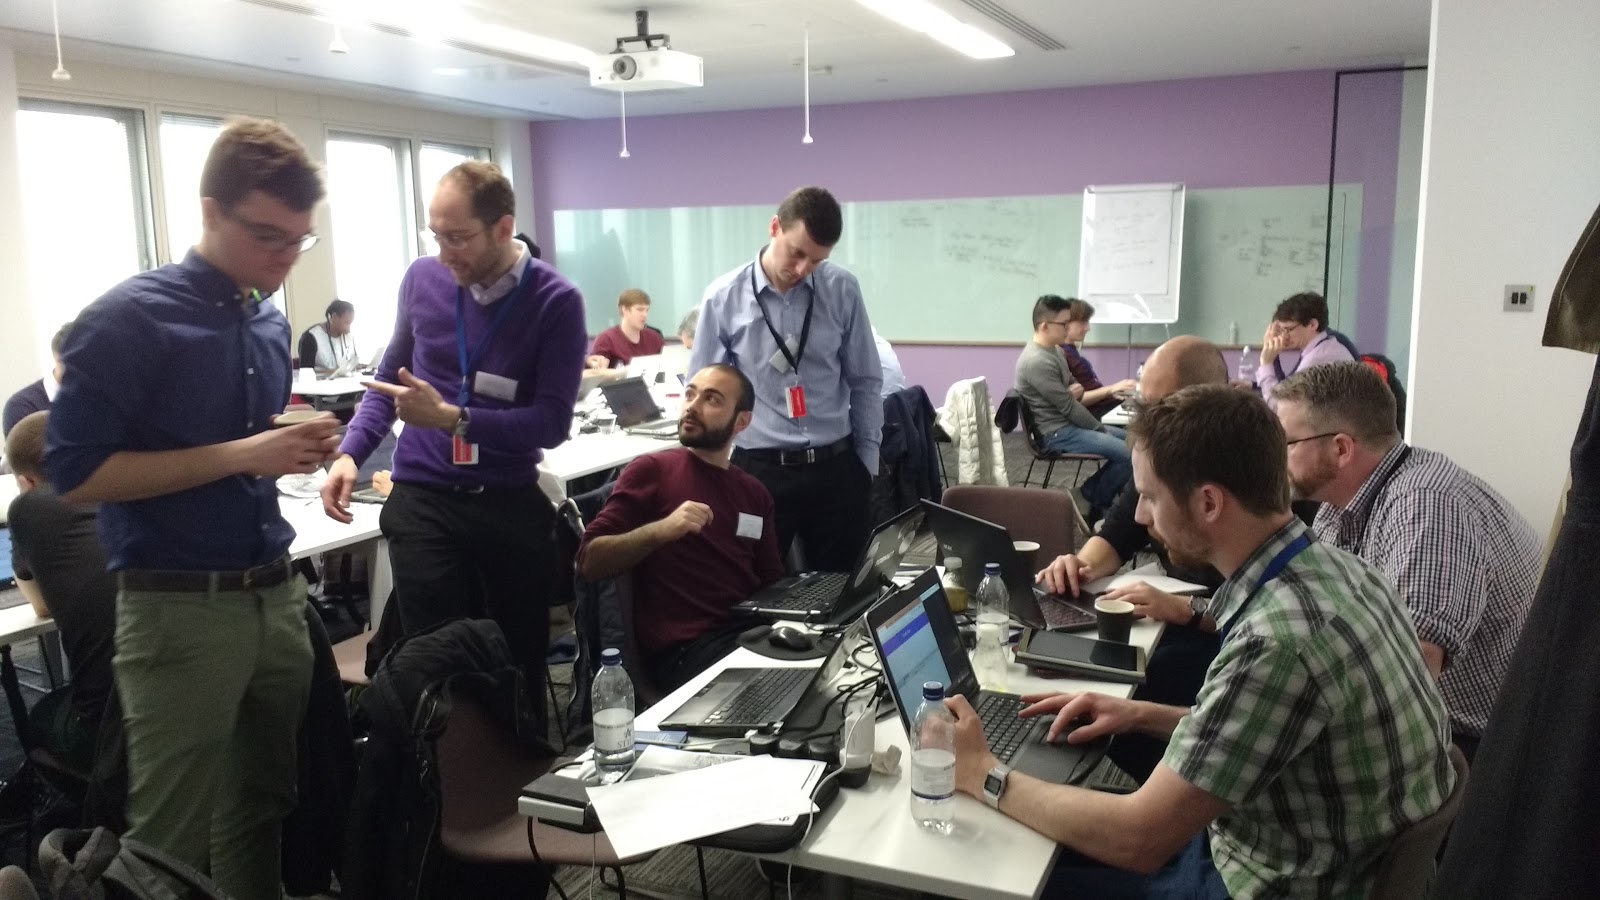
On 6th April, R&D Engineer, Manuel, attended the Traffic Data Hack event organised by Transport for London (TfL) and Amazon Web Services (AWS), tackling the challenge of storing and processing huge amounts of data.
One of the technologies that TfL uses for storing this data is Amazon Redshift, a petabyte-scale data warehouse service in the cloud based on PostgreSQL. The attendees were given the opportunity to query a small portion of this data during the hack event (3 months of a subset of sensors). Data processing is done following a workflow which includes Amazon EMR (Elastic MapReduce) service.
Attendees of the hackathon were split into small groups to tackle different problems using any of these Amazon services. Manuel joined one of the data visualisation teams with members from TfL and Jacobs. One of the first challenges that they discovered was the complexity of the database. After brainstorming, the team decided to visualize the amount of traffic recorded by the sensors at different times of the day. They split their work to effectively create a pipeline of data selection, data preparation and data visualization.
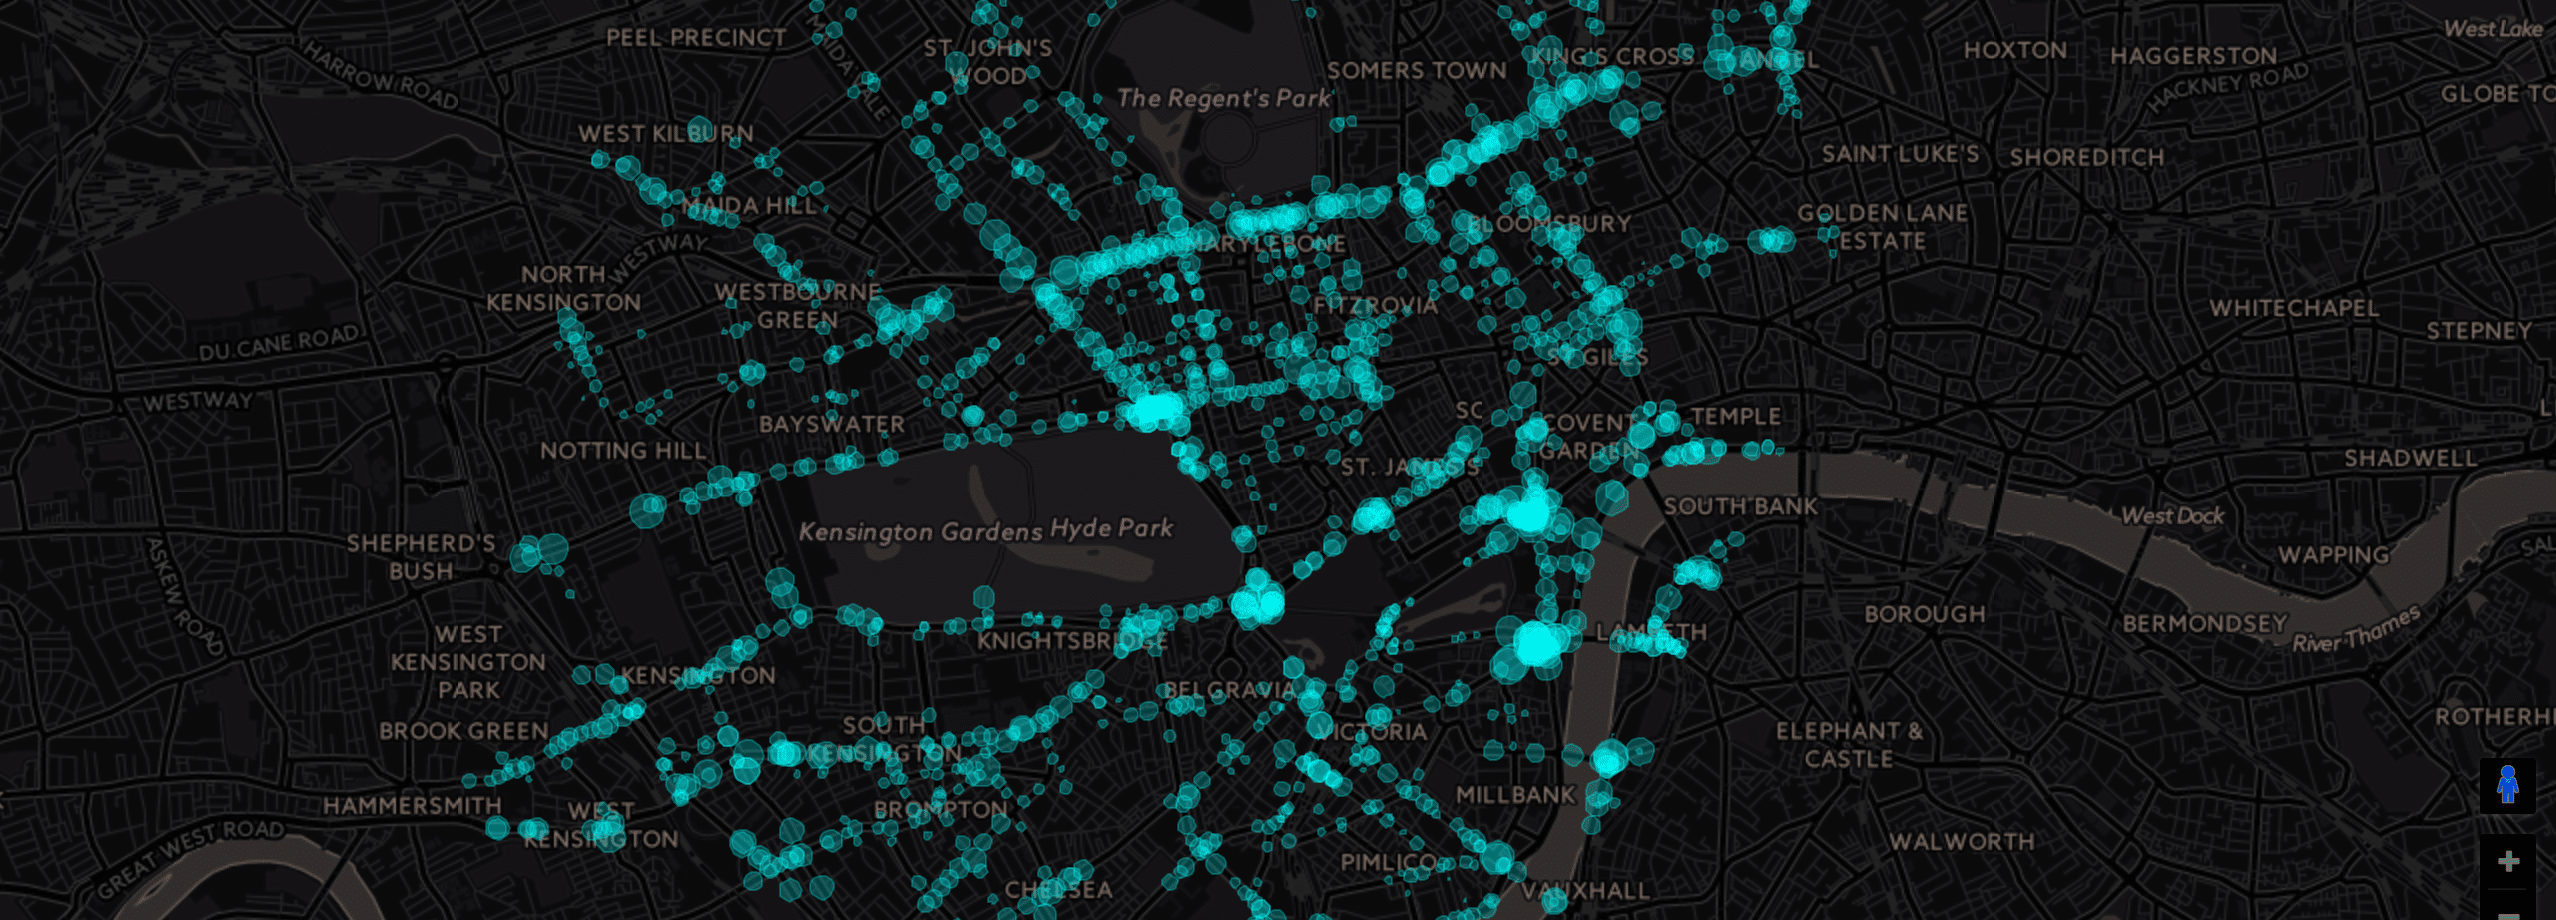
Raw data was extracted from the database by three periods of time (morning peak, inter-peak and evening peak) using SQL queries. Then, they aggregated the data to get the average amount of traffic. After that, sensors had to be matched with their corresponding geolocation that the team had to convert from ordnance survey coordinates to GPS coordinates. Finally, after creating a JSON file with all this information, Manuel and his team visualised each sensor in a map using Google Maps API in which each circle represents a sensor and how busy is that road in a particular time of the day (see picture below).
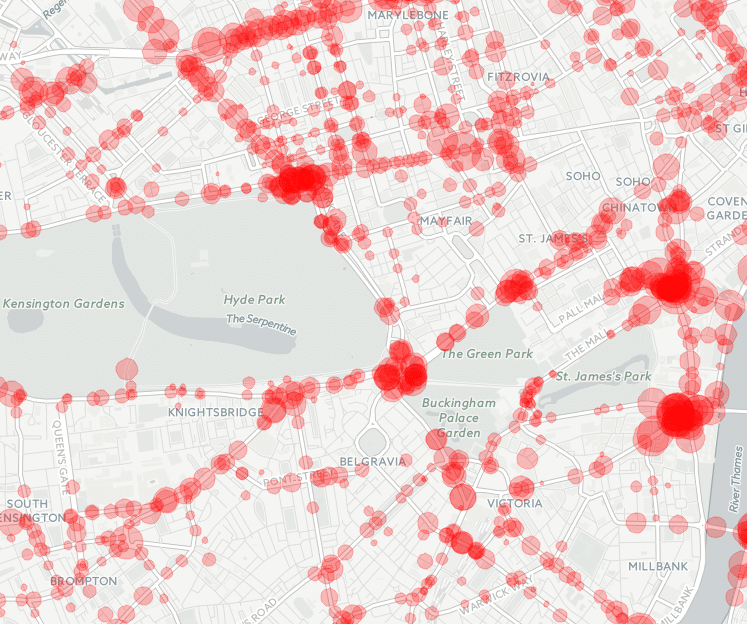 Average traffic congestion in morning peak
Other solutions that were introduced by the other teams included a REST API that allows users to query data easily, a Machine Learning solution to predict traffic congestion and an anomaly detection approach to alert about possible accidents.
In 2015, TfL invested £4bn to improve and modernise traffic and public transport. There is indeed a big interest among both citizens and governments to guide people’s mobility and apply smart solutions every step of the way.
With such a huge quantity of data points adding up daily for London, the future of this data analysis will only get exponentially larger as the same sensors and data expand across the UK.
Share this article

Newsletter
We care about protecting your data. Here’s our Privacy Policy.
Related news

Start your journey with Passenger
If you want to learn more, request a demo or talk to someone who can help you take the next step forwards, just drop us a line.