Experimenting with open elevation data for journey accessibility
As the DfT ramps up publicity for its new Bus Open Data Digital Service, we share our experiments with open elevation data.
27th Dec 2019


As the Department for Transport ramps up publicity for its new Bus Open Data Digital Service, due to land in early 2020, we take a look at some recent Passenger experimentation with open elevation data.
These particular open datasets would have been near impossible for us to create ourselves as a few satellites were needed to scan, process and store data covering planet Earth. These are the kind of datasets only government-sized organisations with deep pockets can build.
Like a lot of good software teams, experimentation plays a big part in what we do at Passenger. We do this to try out new ideas that might improve our products for customers and users. Some experiments lead to exciting new features, some don’t. Without question, they all help to shape what we do next.
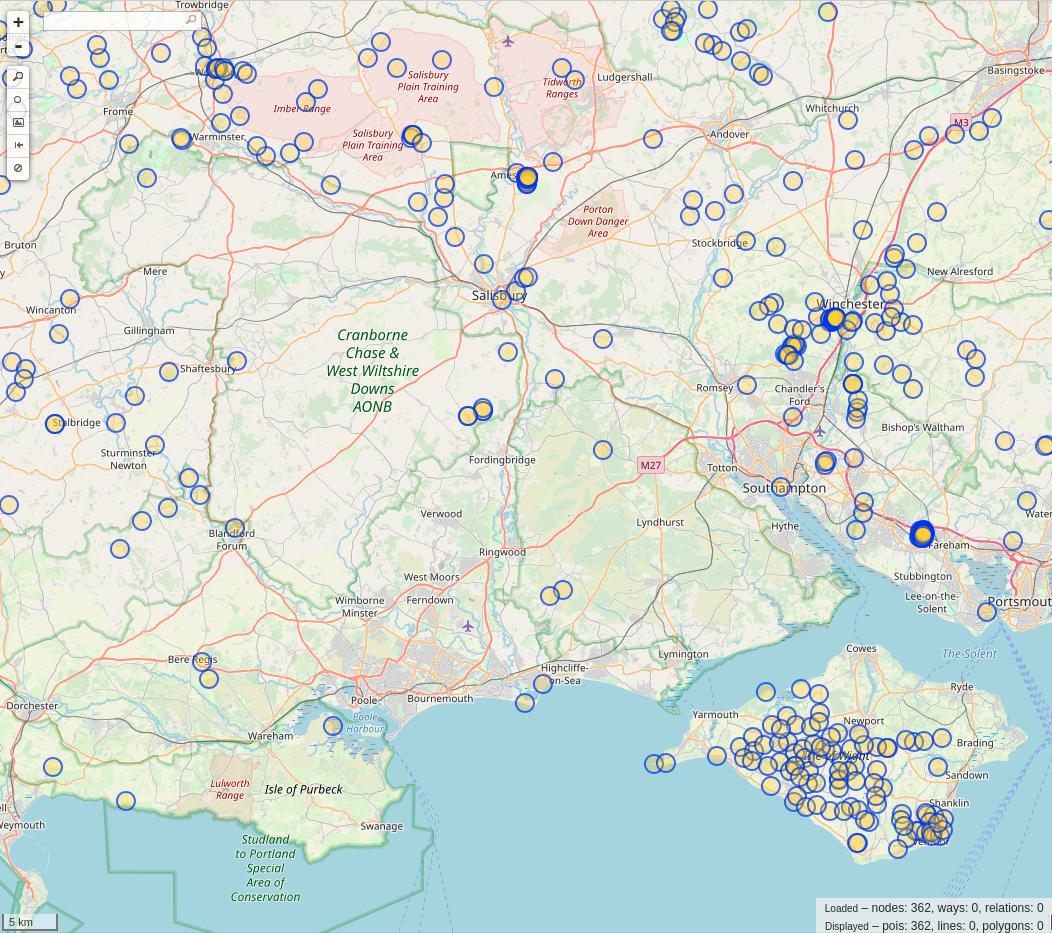
As part of some recent work to replace our map tiles solution, we experimented with several open datasets to see if they might be useful for generating accurate and highly visual map tiles. One type we experimented with was elevation datasets. We thought it might be helpful for some users, particularly those with disabilities if our journey planner accounted for elevation, i.e. routes with hills.
Our journey planning solution uses public OpenStreetMap data to create journey plans. OSM is a brilliant dataset for mapping places, roads, walkways etc., but its elevation data isn’t great.
Using overpass turbo, a web-based data mining tool for OSM, you can see just how few nodes have the “ele” (elevation) tag. This method of handling elevation data isn’t particularly graceful, as it can only apply to a whole node/way/relation in OSM, when elevation is most accurately described as a gradient.
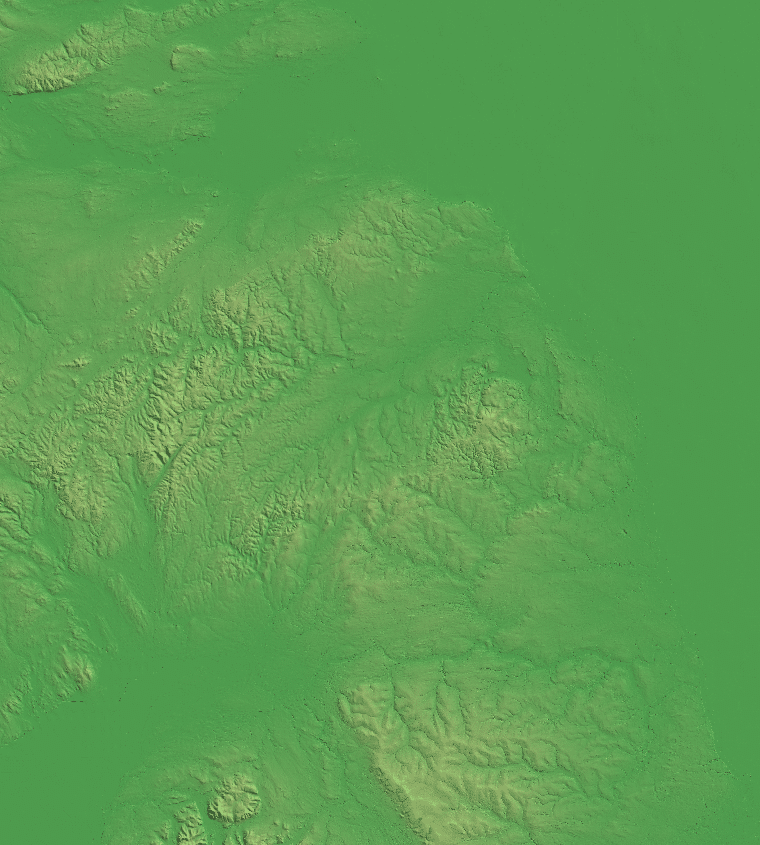
The type of dataset that suits the use case of journey planning, is called a Digital Elevation Model (DEM) raster. This format is essentially an image that shows the elevation of an area, with a brightness value on each pixel within the image.
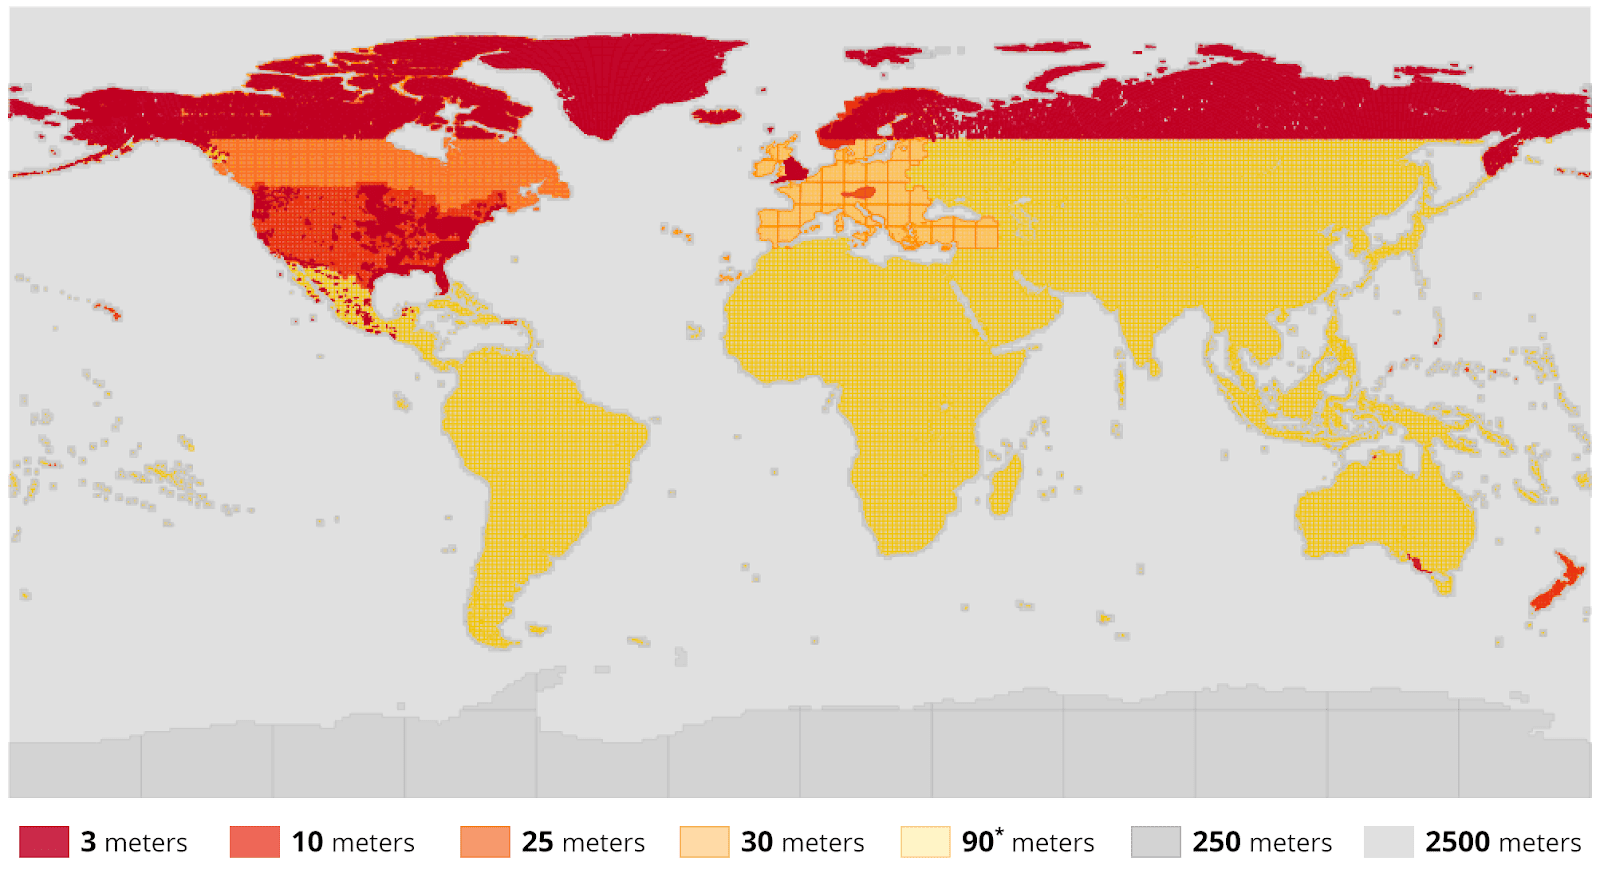
NASA’s Shuttle Radar Topography Mission (SRTM) dataset is the de-facto dataset used for elevation data processing. The raw dataset has a resolution of 1-arc second (30m along the equator). Most of the world has been covered by this dataset ranging from 54°S to 60°N.
Another popular dataset is the Advanced Spaceborne Thermal Emission and Reflection Radiometer (ASTER) Global Digital Elevation Model (GDEM). The ASTER GDEM covers the planet from 83°S to 83°N, and is the first earth mapping system that provides comprehensive coverage of the polar regions.
Just to add a little more complexity, there are also meta-datasets. These are datasets comprised of multiple source datasets, such as EU-DEM which is a hybrid of SRTM and ASTER GDEM. There are lots of others too, like 3DEP, CDEM, GMTED and local government datasets.
What we really wanted was a single source of terrain data that could be queried on a per-tile basis. After some poking around online, we discovered a wonderful resource called the “Terrain Tiles” dataset from Mapzen. This is indexed by the AWS Public Dataset Program and is a great example of how open data can make these complex numerous datasets far more valuable and easy to integrate.
Some of the relevant underlying data sources are a mix of:
- data.gov.uk, 2 metres over most of the United Kingdom
- ETOPO1 for ocean bathymetry, 1 arc-minute resolution globally
- EUDEM in most of Europe at 30 metre resolution
- GMTED globally, coarser resolutions at 7.5″, 15″, and 30″ inland areas
- SRTM globally except high latitudes, 30 metres (90 metres nominal quality) inland areas
The tiles can be queried at various zoom levels (0-15) which correlate to a value in metres at a given latitude. As a balance between the amount of data+processing time vs business value, we settled on a zoom level of 11.
| 0° | 45° | 60° |
| 76.4m | 54.0m | 38.2m |
We created a similar setup to our OSM import process, with a Docker container that runs on AWS Batch. This process downloads tiles for each operator boundary, merges+resamples them and produces a single GeoTIFF elevation raster that we can feed into our journey planner as part of our graph build process.


AWS provides a really valuable service via it’s Public Dataset program by helping to make the datasets themselves easily accessible. Many of the underlying data sources are unreliable and slow to download from. AWS handles the storage cost, on its S3 service, for this public dataset and many others free of charge. Mapzen have done an amazing job on the dataset too.
The visuals produced as part of these experiments look stunning in their own right. The underlying elevation information could be included within our journey planning and may provide value to users simply by showing them the overall elevation gain of a journey. We may also be able to combine some of our recent Public Bike Share integration work on to help users plan multi-leg journeys that avoid (or find!) hilly journeys on the bike leg.
As always, our experiments create the potential for product improvements. Open data enables those experiments in the first place.

Newsletter
We care about protecting your data. Here’s our Privacy Policy.
Related news

Start your journey with Passenger
If you want to learn more, request a demo or talk to someone who can help you take the next step forwards, just drop us a line.